
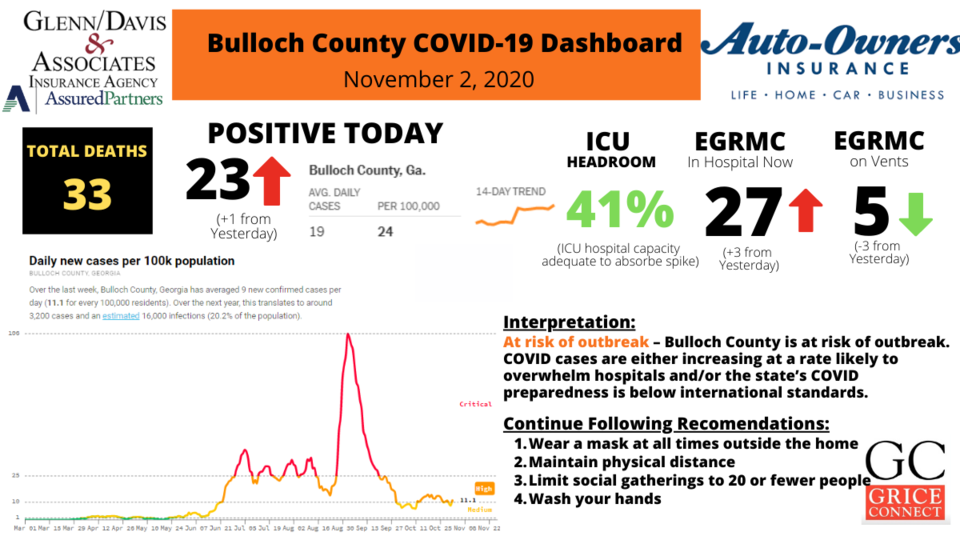
Bulloch County reports a second day of 20+ positive cases. Bulloch's percent positive has also gone back up from the low of 4.7% to 9.3% today. This is a reminder that as the holiday activities come to a close, citizens must still be cautious. Please wear your masks in public, avoid large gatherings and wash your hands often.
Bulloch County Report
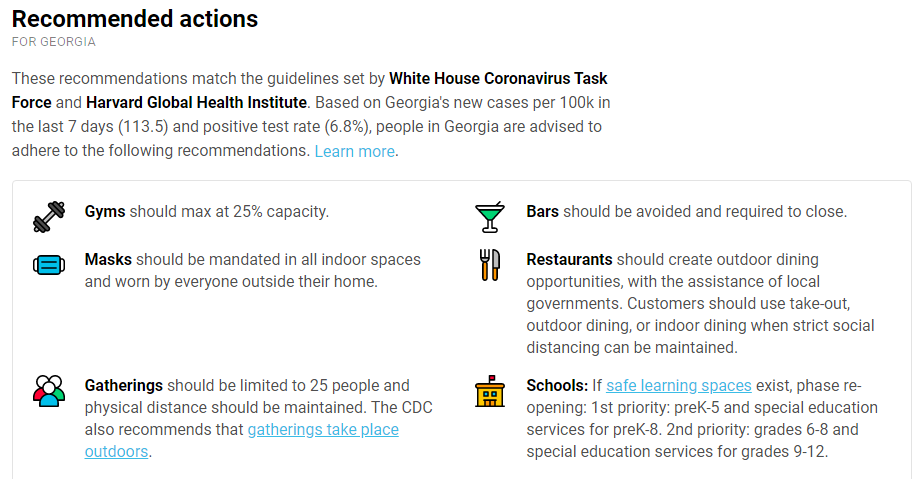
- Bulloch County 14 day average of positive cases per 100,000 is 137 and percent of positive tests is 9.3%. (Targets are below 100 per 100,000 and positive tests at 5% or below).
- 3,129 Total confirmed cases and 33 deaths total reported here with 147 hospitalizations total. Up 23 confirmed (DPH gives no explanation for decrease) since yesterday. (These figures apply to Bulloch County residents)
- EGRMC currently/today caring for 27 COVID-19 positive patients today. (May or may not be Bulloch County residents.) 5 COVID-19 patients on vents. EGRMC has 17 total vents. However, this is reporting only COVID-19 patients on vents. It is unknown how many actual vents are in use at this time at EGRMC.
- EMS received notice of 138 confirmed COVID-19 positive and 128 probable patients transported to date
Bulloch Schools, Colleges and University Report
- Bulloch Schools total since reporting began on August 18 as of October 31, 2020
- 119 total known positive COVID-19 cases reported
- 6 week ending August 21
- 23 week ending August 28
- 21 week ending September 5
- 14 week ending September 11
- 12 week ending September 18
- 13 week ending September 25
- 6 week ending October 2
- 4 week ending October 11
- 8 week ending October 16
- 8 week ending October 24
- 4 week ending October 31
- 0 week ending November 1
- 1065 Quarantines - Total students and employees quarantined for 14 days as a precaution
- 68 currently being quarantined
- 84 week ending August 21
- 284 week ending August 28
- 97 week ending September 5
- 101 week ending September 11
- 121 week ending September 18
- 145 week ending September 25
- 64 week ending October 2
- 45 week ending October 11
- 42 week ending October 17
- 68 week ending October 24
- 28 week ending October 31
- 0 week ending November 1
- 11 Clusters - Total COVID-19 Clusters
- 119 total known positive COVID-19 cases reported
- Georgia Southern COVID-19 since reporting began on August 17 total cases for Statesboro
- 1,036 Total Statesboro Campus Since August 17th
- 61 week ending 8/23
- 487 week ending 8/30
- 351 week ending 9/6
- 90 week ending 9/13
- 47 week ending 9/20
- 15 week ending 9/27
- 10 week ending 10/4
- 12 week ending 10/11
- 16 week ending 10/18
- 14 week ending 10/25
- 10 week ending 11/1
- Ogeechee Technical College COVID-19 since reporting began on August 17
- 29 total Statesboro Campus since August 17th
- 0 week ending 8/23
- 6 week ending 8/30
- 12 week ending 9/6
- 6 week ending 9/13
- 5 week ending 9/20
- 1 week ending 9/27
- 2 week ending 10/4
- 6 week ending 10/11
- 3 week ending 10/18
- 1 week ending 10/25
- 0 week ending 11/1
- East Georgia State College since reporting began on August 17
- 28 total Statesboro Campus since June
- 2 from June
- 0 from July
- 13 from August
- 4 from September through 9/4
- 8 week ending 9/13
- 1 week ending 9/20
- 0 week ending 9/27
- 2 week ending 10/4
- 4 week ending 10/11
- 0 week ending 10/18
- 2 week ending 10/25
- 0 week ending 11/1
Evans County Report:
- Evans County 14 day average of positive cases per 100,000 is 197 and percent of positive tests is 11.0%. (Targets are below 100 per 100,000 and positive tests at 5% or below).
- 490 Total confirmed cases and 7 deaths total reported with 46 total hospitalizations. (This is an increase of 1 confirmed cases, increase of 0 hospitalization and 0 deaths from yesterday)
Candler County Report:
- Candler County 14 day average of positive cases per 100,000 is 258 and percent of positive tests is 12.5. (Targets are below 100 per 100,000 and positive tests at 5% or below).
- 550 total confirmed cases and 25 deaths total reported with 40 total hospitalizations. (This is an increase of 3 confirmed cases, an increase of 1 hospitalizations and an increase of 0 deaths from yesterday)
BULLOCH LONG-TERM CARE FACILITY 11/1/20 REPORT
| FACILITY | NUMBER OF RESIDENTS | POSITIVE RESIDENTS | COVID DEATHS | RESIDENTS TESTED | RECOVERED | POSITIVE STAFF |
|---|---|---|---|---|---|---|
| BROWNS | 51 | 27 | 5 | 59 | 22 | 17 |
| EAGLE | 44 | 1 | 0 | 44 | 1 | 7 |
| GARDENS | 28 | 5 | 0 | 32 | 5 | 0 |
| HERITAGE | 60 | 24 | 4 | 82 | 20 | 12 |
| BETHANY | 22 | 19 | 1 | 31 | 18 | 19 |
| WILLOW POND | 34 | 2 | 1 | 71 | 1 | 5 |
| WESTWOOD | 30 | 10 | 2 | 46 | 5 | 10 |
EVANS COVID-19 DEATHS
| AGE | SEX | RACE | COMORBIDITY |
|---|---|---|---|
| 59 | M | Black | Yes |
| 62 | M | White | Yes |
| 67 | M | Black | Yes |
| 75 | F | Black | No |
| 75 | F | Black | Unknown |
| 76 | M | Black | Yes |
| 85 | F | White | No |
CANDLER COVID-19 Deaths
| ORDER | AGE | SEX | RACE | COMORBIDITY |
|---|---|---|---|---|
| 4 | 46 | F | White | Yes |
| 16 | 49 | M | Black | No |
| 10 | 53 | M | Black | No |
| 20 | 54 | F | Unknown | Unknown |
| 22 | 55 | M | White | No |
| 2 | 56 | F | Black | Yes |
| 8 | 61 | M | White | No |
| 12 | 62 | M | White | No |
| 6 | 64 | F | Black | No |
| 15 | 64 | M | Black | No |
| 5 | 68 | M | White | No |
| 11 | 70 | M | Black | No |
| 13 | 72 | M | White | Yes |
| 1 | 73 | F | White | No |
| 7 | 75 | F | White | No |
| 21 | 76 | M | White | Yes |
| 23 | 76 | F | White | Unknown |
| 14 | 77 | F | White | Yes |
| 17 | 77 | F | Black | Unknowm |
| 24 | 77 | M | Black | No |
| 9 | 83 | M | Black | No |
| 3 | 86 | M | White | Yes |
| 25 | 88 | M | Other | Yes |
| 18 | 90+ | M | White | Yes |
BULLOCH COVID-19 DEATHS
| ORDER | AGE | SEX | RACE | COMORBIDITY |
|---|---|---|---|---|
| 24 | 36 | F | White | No |
| 17 | 38 | F | White | Unknown |
| 2 | 42 | F | Black | Yes |
| 7 | 47 | M | Other | Unknown |
| 8 | 52 | M | Black | Yes |
| 15 | 60 | F | Black | Yes |
| 5 | 62 | F | White | Yes |
| 19 | 63 | F | Black | Yes |
| 32 | 63 | F | White | Unknown |
| 1 | 65 | M | White | Unknown |
| 13 | 65 | M | White | Yes |
| 16 | 66 | F | White | Yes |
| 23 | 67 | F | White | Yes |
| 30 | 67 | M | White | No |
| 14 | 68 | M | Black | Yes |
| 26 | 69 | F | Black | Yes |
| 28 | 69 | F | Black | Yes |
| 21 | 71 | F | White | No |
| 22 | 72 | M | White | Yes |
| 9 | 73 | M | Black | Yes |
| 25 | 74 | F | White | Yes |
| 29 | 74 | M | White | Yes |
| 3 | 76 | F | White | No |
| 10 | 76 | F | White | Yes |
| 12 | 77 | F | White | No |
| 27 | 78 | F | White | No |
| 31 | 79 | M | Black | No |
| 20 | 83 | F | White | Unknown |
| 11 | 88 | M | Black | Yes |
| 33 | 88 | F | White | Yes |
| 18 | 89 | M | White | No |
| 4 | 90+ | F | White | Unknown |
| 6 | 90+ | F | Black | Yes |
About This Report
A special thanks to Dr. Frank Davis, M.D. F.A.C.S, a retired trauma surgeon who lives in Bulloch County. He has worked closely with the Grice Connect team to design the COVID-19 dashboard and provide brief interpretation of the data. You will be seeing and hearing more from Dr. Davis as he continues to help us monitor the COVID-19 impact locally.
We also want to thank Sean Davis and his team at Glenn Davis Insurers and Auto Owners Insurers for stepping up to sponsor this massive effort daily. They understand the importance of providing the best local data possible so their clients, family and friends can navigate this continuing crisis.
Thanks for supporting and following Grice Connect.
TELL US WHAT YOU THINK ABOUT GRICE CONNECT


