
Yesterday, Bulloch BOE reversed course and temporarily rescinded their decision to stop following CDC and DPH recommendations regarding how they quarantine students who had been exposed to a COVID positive.
Today BOE reported 6 positive cases and quarantine of 42 throughout the school system. This brings them to a total of 105 positive cases and 984 total quarantined since they returned to school on August 17.
This comes at a time where many parents are trying to decide which instructional model they would like their students to participate in, either virtual or in person. Parents have until October 28 to decide for the second semester of the school year.
The board of education will meet in a work session on October 22 to discuss the quarantine issue.
Bulloch County Report
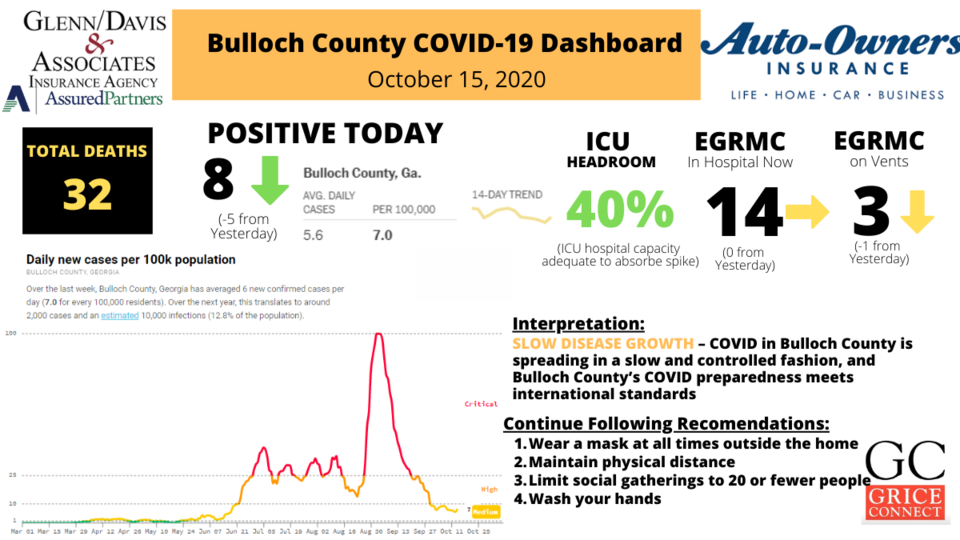
- Bulloch County 14 day average of positive cases per 100,000 is 113 and percent of positive tests is 6.3%. (Targets are below 100 per 100,000 and positive tests at 5% or below).
- 2,987 Total confirmed cases and 32 deaths total reported here with 136 hospitalizations total. Up 8 confirmed since yesterday. (These figures apply to Bulloch County residents)
- EGRMC currently/today caring for 14 COVID-19 positive patients today. (May or may not be Bulloch County residents) 3 COVID-19 patients on vents. EGRMC has 17 total vents. However, this is reporting only COVID-19 patients on vents. It is unknown how many actual vents are in use at this time.
- EMS received notice of 134 confirmed COVID-19 positive and 127 probable patients transported to date
Bulloch Schools, Colleges and University Report
- Bulloch Schools total since reporting began on August 18 as of October 15, 2020
- 105 total known positive COVID-19 cases reported
- 6 week ending August 21
- 23 week ending August 28
- 21 week ending September 5
- 14 week ending September 11
- 12 week ending September 18
- 13 week ending September 25
- 6 week ending October 2
- 4 week ending October 11
- 6 week ending October 16
- 983 Quarantines - Total students and employees quarantined for 14 days as a precaution
- 84 week ending August 21
- 284 week ending August 28
- 97 week ending September 5
- 101 week ending September 11
- 121 week ending September 18
- 145 week ending September 25
- 64 week ending October 2
- 45 week ending October 11
- 42 week ending October 17
- 3 Clusters - Total COVID-19 Clusters
- 105 total known positive COVID-19 cases reported
- Georgia Southern COVID-19 since reporting began on August 17 total cases for Statesboro
- 1,036 Total Statesboro Campus Since August 17th
- 61 week ending 8/23
- 487 week ending 8/30
- 351 week ending 9/6
- 90 week ending 9/13
- 47 week ending 9/20
- 15 week ending 9/27
- 10 week ending 10/4
- 12 week ending 10/11
- Ogeechee Technical College COVID-19 since reporting began on August 17
- 29 total Statesboro Campus since August 17th
- 0 week ending 8/23
- 6 week ending 8/30
- 12 week ending 9/6
- 6 week ending 9/13
- 5 week ending 9/20
- 1 week ending 9/27
- 2 week ending 10/4
- 6 week ending 10/11
- East Georgia State College since reporting began on August 17
- 28 total Statesboro Campus since June
- 2 from June
- 0 from July
- 13 from August
- 4 from September through 9/4
- 8 week ending 9/13
- 1 week ending 9/20
- 0 week ending 9/27
- 2 week ending 10/4
- 4 week ending 10/11
Evans County Report:
- Evans County 14 day average of positive cases per 100,000 is 150 and percent of positive tests is 7.9%. (Targets are below 100 per 100,000 and positive tests at 5% or below).
- 450 Total confirmed cases and 6 deaths total reported with 42 total hospitalizations. (This is an increase of 1 confirmed cases, increase of 2 hospitalization and 0 deaths from yesterday)
Candler County Report:
- Candler County 14 day average of positive cases per 100,000 is 388 and percent of positive tests is 21.6. (Targets are below 100 per 100,000 and positive tests at 5% or below).
- 509 total confirmed cases and 23 deaths total reported with 35 total hospitalizations. (This is an increase of 2 confirmed cases, an increase of 0 hospitalizations and an increase of 0 deaths from yesterday)
BULLOCH LONG-TERM CARE FACILITY 10/15/20 REPORT
| FACILITY | NUMBER OF RESIDENTS | POSITIVE RESIDENTS | COVID DEATHS | RESIDENTS TESTED | RECOVERED | POSITIVE STAFF |
|---|---|---|---|---|---|---|
| BROWNS | 51 | 27 | 5 | 59 | 22 | 17 |
| EAGLE | 45 | 1 | 0 | 44 | 1 | 7 |
| GARDENS | 26 | 5 | 0 | 32 | 5 | 0 |
| HERITAGE | 60 | 24 | 4 | 79 | 20 | 12 |
| BETHANY | 36 | 19 | 1 | 31 | 18 | 18 |
| WILLOW POND | 34 | 2 | 1 | 71 | 1 | 4 |
| WESTWOOD | 29 | 10 | 2 | 46 | 5 | 10 |
EVANS COVID-19 DEATHS
| AGE | SEX | RACE | COMORBIDITY |
|---|---|---|---|
| 59 | M | Black | Yes |
| 62 | M | White | Yes |
| 67 | M | Black | Yes |
| 75 | F | Black | No |
| 76 | M | Black | Yes |
| 85 | F | Unknown | No |
CANDLER COVID-19 Deaths
| ORDER | AGE | SEX | RACE | COMORBIDITY |
|---|---|---|---|---|
| 4 | 46 | F | White | Yes |
| 16 | 49 | M | Black | No |
| 10 | 53 | M | Black | No |
| 20 | 54 | F | Unknown | Unknown |
| 22 | 55 | M | White | No |
| 2 | 56 | F | Black | Yes |
| 8 | 61 | M | White | No |
| 12 | 62 | M | White | No |
| 6 | 64 | F | Black | No |
| 15 | 64 | M | Black | No |
| 5 | 68 | M | White | No |
| 11 | 70 | M | Black | No |
| 13 | 72 | M | White | Yes |
| 1 | 73 | F | White | No |
| 7 | 75 | F | White | No |
| 21 | 76 | M | White | Yes |
| 23 | 76 | F | White | Unknown |
| 14 | 77 | F | White | Yes |
| 17 | 77 | F | Black | Unknowm |
| 9 | 83 | M | Black | No |
| 3 | 86 | M | White | Yes |
| 18 | 90+ | M | White | Yes |
BULLOCH COVID-19 DEATHS
| ORDER | AGE | SEX | RACE | COMORBIDITY |
|---|---|---|---|---|
| 24 | 36 | F | White | No |
| 17 | 38 | F | White | Unknown |
| 2 | 42 | F | Black | Yes |
| 7 | 47 | M | Other | Unknown |
| 8 | 52 | M | Black | Yes |
| 15 | 60 | F | Black | Yes |
| 5 | 62 | F | White | Yes |
| 19 | 63 | F | Black | Yes |
| 32 | 63 | F | White | Unknown |
| 1 | 65 | M | White | Unknown |
| 13 | 65 | M | White | Yes |
| 16 | 66 | F | White | Yes |
| 23 | 67 | F | White | Yes |
| 30 | 67 | M | White | No |
| 14 | 68 | M | Black | Yes |
| 26 | 69 | F | Black | Yes |
| 28 | 69 | F | Black | Yes |
| 21 | 71 | F | White | No |
| 22 | 72 | M | White | Yes |
| 9 | 73 | M | Black | Yes |
| 25 | 74 | F | White | Yes |
| 29 | 74 | M | White | Yes |
| 3 | 76 | F | White | No |
| 10 | 76 | F | White | Yes |
| 12 | 77 | F | White | No |
| 27 | 78 | F | White | No |
| 31 | 79 | M | Black | No |
| 20 | 83 | F | White | Unknown |
| 11 | 88 | M | Black | Yes |
| 18 | 89 | M | White | No |
| 4 | 90+ | F | White | Unknown |
| 6 | 90+ | F | Black | Yes |
About This Report
A special thanks to Dr. Frank Davis, M.D. F.A.C.S, a retired trauma surgeon who lives in Bulloch County. He has worked closely with the Grice Connect team to design the COVID-19 dashboard and provide brief interpretation of the data. You will be seeing and hearing more from Dr. Davis as he continues to help us monitor the COVID-19 impact locally.
We also want to thank Sean Davis and his team at Glenn Davis Insurers and Auto Owners Insurers for stepping up to sponsor this massive effort daily. They understand the importance of providing the best local data possible so their clients, family and friends can navigate this continuing crisis.
Thanks for supporting and following Grice Connect.
TELL US WHAT YOU THINK ABOUT GRICE CONNECT


