

To ensure that the numbers being provided through the COVID-19 data tool are the most current numbers available, the updates will be done at NOON every day.
These data represent confirmed cases of COVID-19 reported to the Georgia Department of Public Health as of 12:00pm 03/19/2020. A confirmed case is defined as a person who has tested positive for 2019 novel coronavirus.
| COVID-19 Confirmed Cases | No. Cases (%) |
|---|---|
| Total | 287 (100%) |
| Deaths | 10 (3.48%) |
| Lab | Number of Positive Tests | Total Tests |
|---|---|---|
| Commercial Lab | 174 | 1323 |
| GPHL | 113 | 508 |
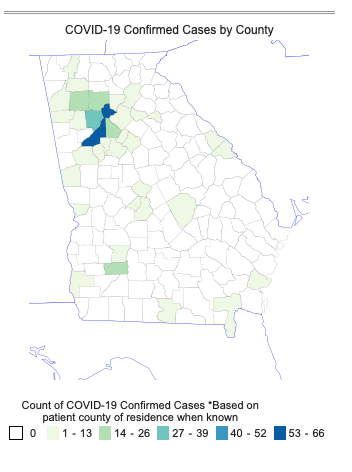
| County | Cases |
|---|---|
| Fulton | 66 |
| Cobb | 37 |
| Bartow | 26 |
| DeKalb | 22 |
| Dougherty | 20 |
| Cherokee | 16 |
| Gwinnett | 12 |
| Fayette | 9 |
| Clarke | 8 |
| Lowndes | 6 |
| Floyd | 6 |
| Clayton | 6 |
| Hall | 5 |
| Gordon | 4 |
| Lee | 3 |
| Coweta | 3 |
| Paulding | 3 |
| Newton | 3 |
| Forsyth | 3 |
| Henry | 3 |
| Early | 2 |
| Glynn | 2 |
| Laurens | 2 |
| Richmond | 2 |
| Troup | 2 |
| Rockdale | 1 |
| Houston | 1 |
| Charlton | 1 |
| Whitfield | 1 |
| Polk | 1 |
| Columbia | 1 |
| Barrow | 1 |
| Bibb | 1 |
| Peach | 1 |
| Muscogee | 1 |
| Unknown | 6 |
*Based on patient county of residence when known
Report generated on: 03/19/2020 11:00:19


